
Kunal Kulkarni
-
Software Development Engineer, Amazon Web Services

My time at CUSP taught me the crucial skill of presenting technical problems to non-technical audiences. This emphasis on effective communication ensured that I could effectively convey complex concepts, addressing the why behind a problem and considering ethical implications.“
We spoke with Kunal about how earning his MS in Applied Urban Science and Informatics helped to shape his future career aspirations. Read our interview for more insights about what it's like to be a student at CUSP!
Tell us about your background and what brought you to CUSP.
Growing up in London and later living in Singapore and Pune, I became fascinated with urban ecosystems, particularly transit systems. I was also intrigued about how things worked from the ground up. This led me to study electronics and telecommunication for my undergraduate degree, where I delved into machine learning and data science.
I have always been captivated by the world of data journalism and have found YouTube channels such as Vox to be particularly intriguing. In university, I published research papers which predicted Covid symptoms using speech data and received a patent for predicting battery life using battery data during an internship. I actively participated in activities such as quiz bowls, model United Nations, and my university’s Hyperloop team. All of these experiences and interests made me realize my passion for using data to make a tangible impact.
While exploring masters programs, I discovered CUSP and I found the MS in Applied Urban Science and Informatics to perfectly align with my interests and aspirations. The rich history and course details convinced me it was the ideal fit.
What was your first semester at CUSP like?
My first semester was an exciting and enriching experience for me. One aspect that stood out was the flexibility the program offered in choosing my courses. I had the opportunity to explore different subjects that aligned with my interests. I appreciated being able to select both technical courses and those related to public policy or business, allowing me to tailor my education to my preferences.
Additionally, I formed deep connections and friendships with fellow students from various disciplines. These connections have become invaluable, and I cherish the lifelong relationships I’ve established through CUSP.
Overall, my first semester at CUSP provided a great balance of academic flexibility and personal connections, making it a truly rewarding experience.
What experiences stood out to you and helped shape your education?
Being an independent individual, I have consistently faced difficulty in maintaining focus during classes that fail to capture my interest. However, CUSP granted me the invaluable freedom to select courses that align with my passions. This newfound academic autonomy allowed me to fully engage and excel in my studies. One course that particularly stood out to me was the independent study I undertook during my spring semester.
For this independent study, I reached out to various urban-related institutes, expressing my eagerness to collaborate on a project. I specifically mentioned that I was a CUSP student and interested in doing an independent study. This approach allowed me to select from multiple project offers received from different companies. I had the opportunity to design the entire project from scratch, engaging in discussions with both CUSP faculty and professionals at the company I eventually worked with, which was Bloomberg Philanthropies.
This experience provided me with valuable insights into how urban organizations operate and allowed me to exercise complete independence in designing the workflow, technical aspects, and writing components of the project. I realized that this work reinforced my passion for data journalism. I now intend to continue exploring this field alongside my current endeavors and potentially pursue it further in the future.
Tell us more about your independent study and the process of completing the project.
During my project with Bloomberg Philanthropies, I had the opportunity to collaborate with various individuals and work with different datasets. After the project began, I was assigned a mentor at Bloomberg and we maintained regular communication. In our first meeting, she introduced me to the National League of Cities (NLC) dataset, which collects qualitative data from different city and government organizations regarding their pandemic response.
The challenge was to transform this qualitative data into a meaningful and insightful story. My mentor encouraged me to explore how we could present it effectively. Inspired by my interest in data journalism, I decided to design a website that would combine data visualization, storytelling, and technical skills. I envisioned a website with a heat map displaying the number of policies implemented by cities over time. I wanted to create an aesthetically pleasing and interactive visualization where the colors on the map would represent the intensity of policy changes. I aimed to use this map as a starting point to craft a narrative and extract data insights.
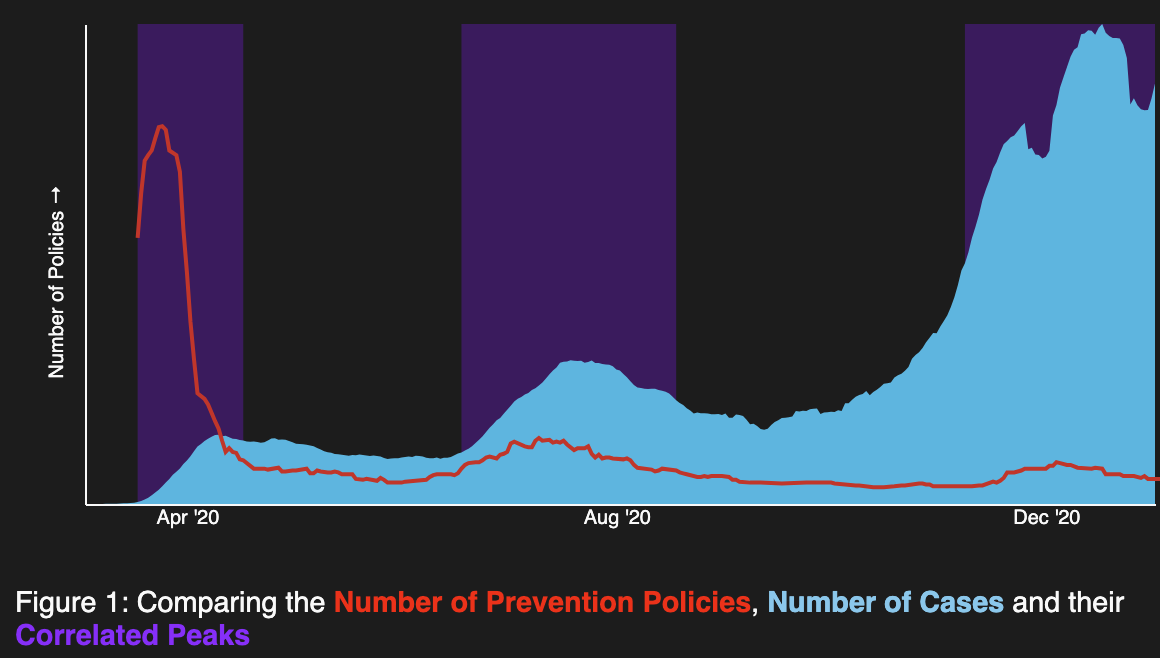
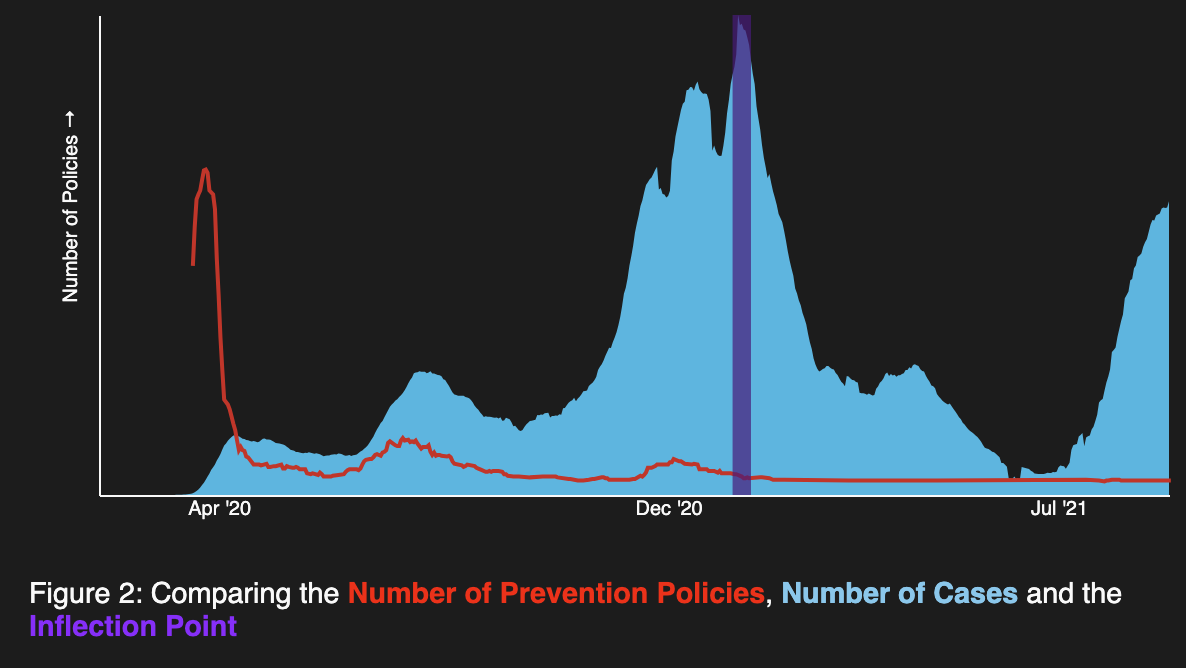
Through my analysis, I discovered three major insights. First, there was a correlation between COVID cases and the policies implemented by cities over time. During the worst periods of the pandemic, more city actions were taken. Second, as the pandemic persisted, cities became more accustomed to dealing with it, resulting in a decrease in the number of policies implemented. Finally, there is an inflection point where the link between prevention policies and COVID-19 cases breaks, as cities became more resilient and developed better strategies for handling the pandemic.
I worked closely with my mentor and leveraged my technical skills to create visually appealing graphics that effectively presented these data insights. This experience allowed me to gain hands-on experience in data journalism and reinforced my passion for the field.
Your heat map visualization is impressive! Did you learn how to create that as you were working on the project, or did you already have some knowledge in that area?
Actually, it’s an interesting story. When I started this project, I had a basic knowledge of coding in Python, which is commonly used for machine learning tasks. However, I had no prior experience with web development languages like JavaScript and CSS, which are essential for creating interactive websites. But I was determined to learn and incorporate those skills into my project.
During the first couple of months, I decided to focus solely on learning how to present the data effectively. I dedicated that time to learning JavaScript, CSS, and React, which is a popular JavaScript library for building user interfaces. It was quite challenging at first, but I was excited about the opportunity to expand my skill set.
After gaining proficiency, I took the plunge and started designing the heat map from scratch. I also explored and utilized various APIs to enhance the functionality of the project. One API that I used was Mapbox, which allowed me to integrate datasets and visualize them on a map using a GeoJSON file. Once the visualization aspect was in place, I shifted my focus to the data analysis part. I leverage my knowledge of Python, SQL, and data science techniques to make sense of the data.
Finally, I brought everything together, integrating the design, the data analysis, and the storytelling aspect of the project. It was a multi-phase process that involved learning new skills, applying my existing knowledge, and constantly iterating to improve the final outcome.
Tell us about your capstone project.
For my capstone, we worked on solving the traveling salesman problem using reinforcement learning and transformers. The project was conducted under the guidance of Professor Mordecai at NYU Courant. Initially, our focus was on optimizing the path for multiple agents and drones.
The traveling salesman problem is a well-known optimization challenge where a salesman needs to find the shortest route to visit a set of cities. In our case, we aimed to apply this problem to the context of disaster relief efforts. By incorporating priorities and urgency levels for different locations, we wanted to determine the most efficient route for drones to navigate and allocate resources effectively when a disaster occurs.
Could you share how the resources available at CUSP helped you with your projects?
As a student at CUSP, I was pleasantly surprised by the abundant resources and opportunities available for studying and analyzing data. The university’s affiliation with the NYC Open Data initiative provided access to a vast collection of urban data. This included diverse datasets on air quality, public transportation usage, pedestrian traffic, and more, which proved immensely valuable across various domains. CUSP also fostered a research environment that prioritized leveraging this data effectively. I observed professors and students from non-technical backgrounds actively engaged in utilizing the data for research purposes, highlighting the significance of data-driven analysis and its impact on civic analytics.
Additionally, my time at CUSP taught me the crucial skill of presenting technical problems to non-technical audiences. This emphasis on effective communication ensured that I could effectively convey complex concepts, addressing the why behind a problem and considering ethical implications.
And now you’re working at Amazon. How does your experience at CUSP help you in your new role?
So in my current project, I’m involved in designing the console for an Amazon service. Essentially, this involves creating the user interface and experience for customers who will be using the service. JavaScript has been incredibly useful in this regard.
At CUSP, as I delved into learning JavaScript, I realized how versatile and powerful it is for web development and creating interactive interfaces. The knowledge I gained not only helped me in designing the console for an Amazon service but also expanded my understanding of programming languages and their practical applications.
Having a solid data-focused foundation from CUSP has proven to be incredibly valuable in my current role. I feel confident in my ability to tackle complex tasks and efficiently develop solutions. It’s amazing how the skills I acquired during my independent study seamlessly transferred to my job, enabling me to hit the ground running and contribute effectively to my team.
Another aspect that I found useful, generally speaking, was the alumni network and the emails students received about job opportunities. These emails would highlight job openings and connect us with CUSP alumni who were working in relevant fields. This allowed us to have conversations with alumni and gain more insights about roles at various companies. It provided a more realistic chance of landing a job and understanding the requirements and expectations of potential employers.
Lastly, any advice for upcoming graduate students at CUSP?
If I were speaking to CUSP students right now, I would advise them to get their hands dirty and explore as much as possible. During my time at CUSP, I realized that if I had the opportunity to stay longer, I would have taken even more diverse courses and expanded my knowledge beyond a specific focus. CUSP offers a wide range of courses, including software, machine learning, data science, civic analytics, and urban sensing. I would urge them to broaden their perspective by taking courses from different disciplines and interacting with people from diverse backgrounds. By doing so, they can learn a lot and gain a deeper understanding of various subjects. It’s important not to stay in the same lane and to embrace the opportunity to learn from different perspectives and experiences.